
Useful Python Code
Import Pandas and Matplotlib libraries
This code imports the pandas library using the shortcode pd so you don't have to write 'pandas' all the time.
The pyplot module from matplotlib is the only thing we need to import from this library. We can use the shortcode plt to refer to this later in the code.
import pandas as pd
import matplotlib.pyplot as plt
df = pd.read_csv('data.csv')
You need to replace 'data.csv' with whatever the filename is - for example Task4a_data.csv.
Read from the CSV File
This code will read the data from the CSV file and store it in a Pandas dataframe. You can think of a dataframe like a table or an Excel spreadsheet where the data is stored in rows and columns.
Mean, Min, Max and Sum
Use this code to find the mean value (average) of the values in a column.
Min will return the lowest value in the column and Max will return the highest value.
Sum will add up all of the numeric values in a column and give you the total. For example, if you need to find the total number of items sold from a column in a dataset.
mean_value = df['Field Name'].mean()
min_value = df['Field Name'].min()
max_value = df['Field Name'].max()
sum_values = df['Field Name'].sum()
unique_values = df['Field Name'].unique()
num_values = df['Field Name'].value_counts()
Value Counts and Unique
Value Counts will count the number of unique values in a column and Unique returns the list of unique values as they occur in the column in order of appearance (they are not sorted).
Working with Dates
When you're working with a field containing a date you need to convert it into a datetime data type so that Pandas can work with it.
This code creates a new dataframe with the date values stored as the date data type. You can also use this to validate user input if you need them to enter a date.
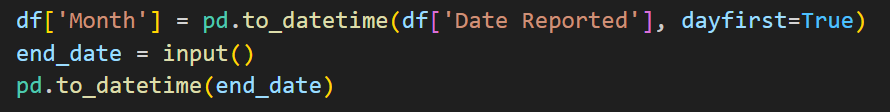
df['Month'] = pd.to_datetime(df['Date Reported'], dayfirst=True)
end_date = input()
pd.to_datetime(end_date)
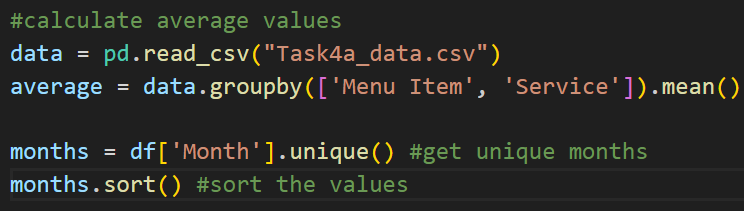
data = pd.read_csv("Task4a_data.csv")
average = data.groupby(['Menu Item', 'Service']).mean()
months = df['Month'].unique()
months.sort()
Groupby and Sort
Groupby is useful for splitting a dataframe into groups based on one or more columns. You can also use it with methods like mean For example, you could organise products by category and then use mean to calculate the average sales.
Sort will just sort the values in a column in ascending or descending order (the default is ascending - smallest to highest).
idxmax and idxmin
In Pandas, each row in the dataframe is given an index - this is like a primary key in a database. It is a unique positive integer that is used to identify each row in the dataframe. The method idxmax will return the index of the row which contains the highest value in the dataset and the idxmin method will return the index of the row which contains the lowest value in the given dataset.
This is useful if you want to analyse peaks and troughs in a dataset. For example: On which day did we make the most/least sales?
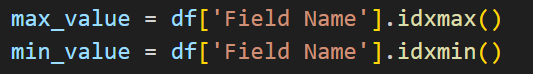
max_value = df['Field Name'].idxmax()
min_value = df['Field Name'].idxmin()
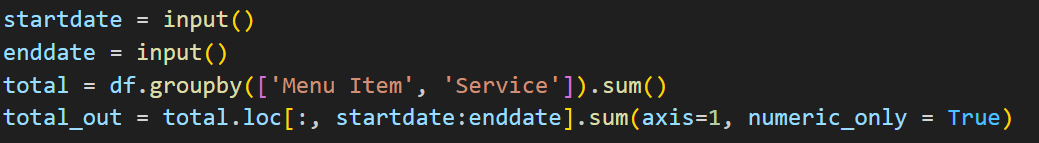
startdate = input()
enddate = input()
total = df.groupby(['Menu Item', 'Service']).sum()
total_out = total.loc[:, startdate:enddate].sum(axis=1, numeric_only = True)
loc and iloc
The loc property allows you to access a cell using the index and column labels. For example, if you've already used idxmax to find a row then you can use loc to access a value in a specific column of that row.
You can also use loc to select multiple rows or columns - for example if you want to select all the data between two given dates.
The iloc property returns the index of the rows/columns you want to select.
Drawing a Bar Chart with Matplotlib
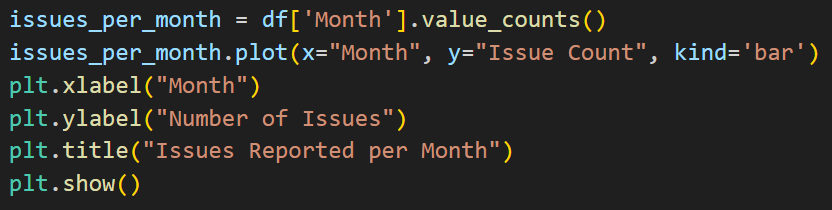
issues_per_month = df['Month'].value_counts()
issues_per_month.plot(x="Month", y="Issue Count", kind='bar')
plt.xlabel("Month")
plt.ylabel("Number of Issues")
plt.title("Issues Reported per Month")
plt.show()
Useful Resources
Geeks for Geeks gives some useful code snippets and explanations of how to use Pandas and Python for data analysis.